Energy Tracking Analytics Software Application:
We have designed and built Enterprise Energy Tracking Analytics (ETA); a cloud hosted solution that allows end users immediate and long term access to energy usage information for over a decade.
This energy data repository enables complex analysis allowing energy usage charting, billing, baseline creation and comparison, clusterd usage views and energy allocation and more as shown below.
ETA is an enterprise level energy management software web portal that automatically collects and manages valuable energy data and then translates the data into useful and actionable insights to users. ETA’s cloud-based robust data capture and analysis help users gain control over their energy costs via variety of interactive and automated energy analytics tools that are delivered via a convenient and easy to use web browser.
ETA manages large volumes of historical data from meters. It presents current data up to the last granular interval, hourly, daily, and monthly or yearly as well as historical data both in tabular and graphical form providing greater visibility and control of energy consumption.
ETA helps uncover hidden saving opportunities in complex energy environments.
Energy Tracking’s proven metering technology and global implementation to over 32 countries world-wide provides best-in-class data analytics capabilities and is an established leader in providing smart energy solutions to help improve operational efficiency, strategic energy management and provide greater visibility.
ETA’s value delivery framework with extensive energy domain expertise provides comprehensive strategic energy management solutions, cost tracking/reduction and more.
Energy Tracking Analytics is a web based energy monitoring application that provides real time access to current and historical
energy usage data for energy monitoring and analysis anytime, anywhere via the Internet using a web browser. It supports time
series data and energy resources such as electric, gas, water, steam, oil, solar, wind, etc.
When Energy Tracking Analytics is used with Energy Tracking’s smart TCP/IP enabled energy meter (WEM-MX)
or the Web Enabled Pulse Module (WEPM), it enables a superior solution with the ability to access data in real time
because both products have onboard web servers that provide data in XML. Both the WEM-MX and WEPM can send periodic
reports via email, ftp or Web Service client (http) enabling additional means of acquiring usage data.
Main features include:
Energy Monitoring & Reporting 24X7.
Consumption and demand reporting - By interval, hourly, daily, weekly, monthly & yearly.
Graphical Load Profile and real-time consumption and demand values such as voltage, current, power factor and more.
Drill down capability with identification of peak consumption and demand.
Baseline creation capability.
Energy Usage Comparison: Meter v/s Meter, Meter v/s Baseline or Baseline v/s Baseline.
Cluster / Group Multiple Meters to Enable Combined Usage.
Energy Allocation - From Multiple Meters.
Billing - Apply energy usage to tariffs.
Charting Voltage, Current, Power factor and Demand.
Rich Reporting - Consumption and summary reports.
Data Export to pdf, Word, Excel and CSV.
Data Sheet for ETA:Click Here.
The following is an example of how ETA is utilized in analyzing the measured and reported data.
Summary Views:
Load Profile Analysis Capability:
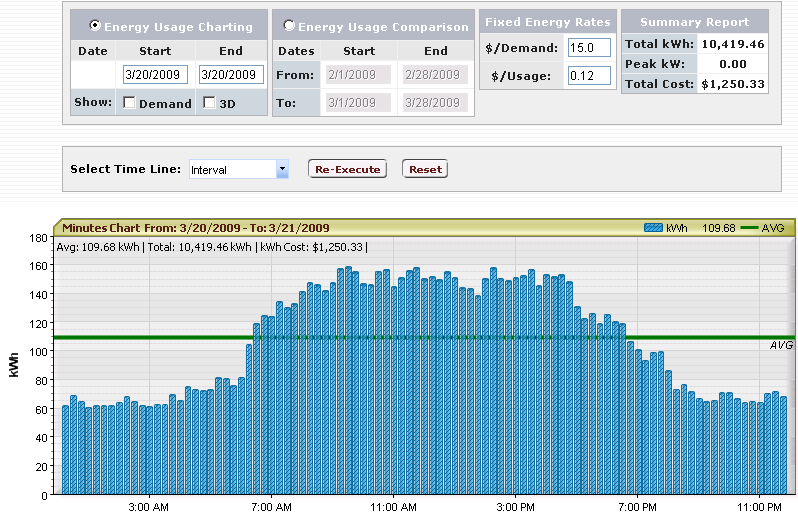
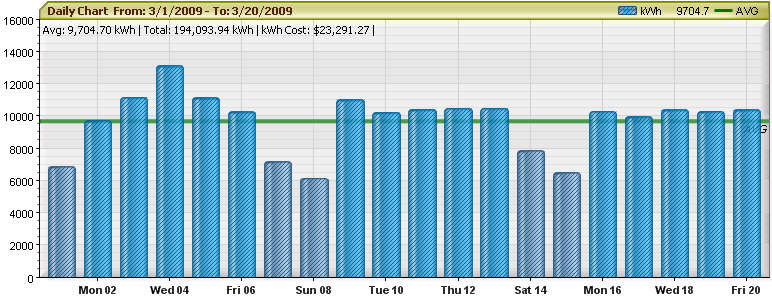
Energy Tracking Analytics can show you exactly where, when and how much energy your facility has consumed and aid
in energy management.
Interval Data Graph - Load Profile Capability:
Daily Data Graph:
Energy Tracking Analytics is a very advanced and powerful application that presents real time energy data from our
meters and loggers. It displays and stores energy usage data in a central database for current and future analysis
from users using a web browser.
Energy Tracking Analytics is an ideal application for energy monitoring and management and is a breakthrough application that helps
users track their energy usage and perform further analysis for energy monitoring on a 24 X 7 basis.
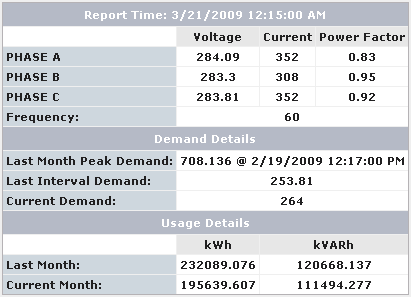
Energy Tracking Analytics also provides statistics on voltage, current, power factor, time of peak demand, current
demand, prior month’s consumption and current month’s consumption till-date.
Key Statistics:
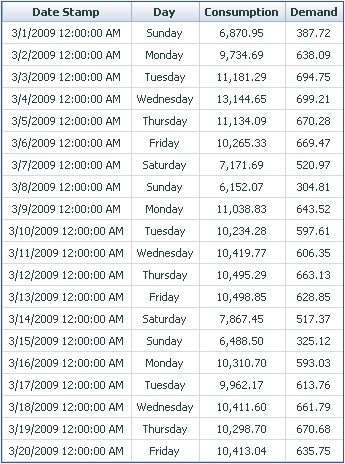
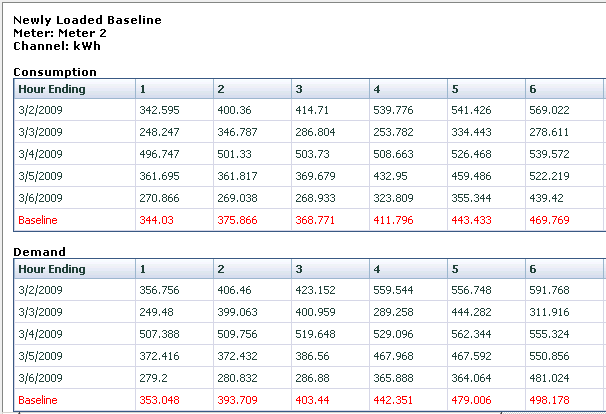
Energy Tracking Analytics also provides Consumption and Demand data in a tabular format.
Consumption and Demand Data in Table:
Energy Tracking Analytics also allows the user to generate and save a Baseline.
The Baseline data can comprise of a range of selected dates.
Baseline Calculations and Graph:
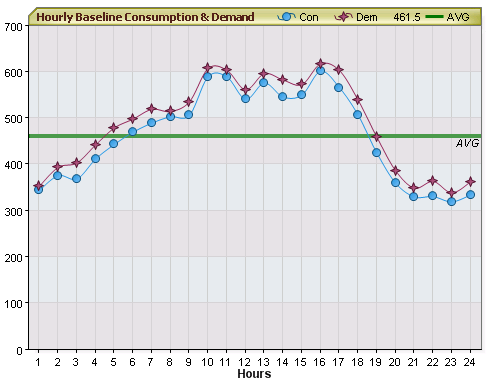
Baseline Details:
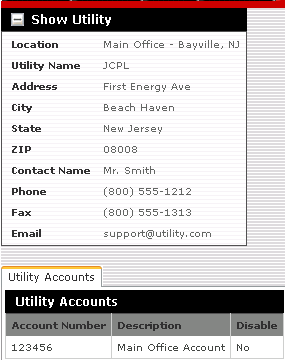
Energy Tracking Analytics also allows the user to enter utility information.
Utility Details Interface:
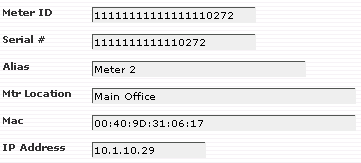
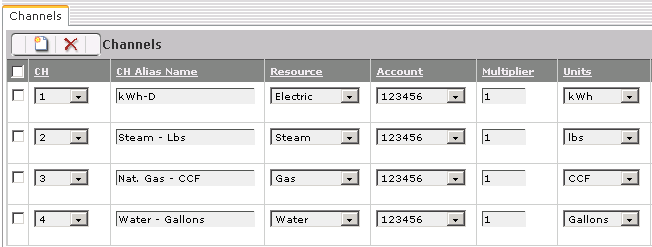
Energy Tracking Analytics also allows the user to map Meter and Channel ID data to Alias’s, utility accounts and consumption units.
Alias Mapping:
Energy Tracking Analytics also allows the user to Export data via pdf, MS Word, MS XCEL or CSV.
Data Export:

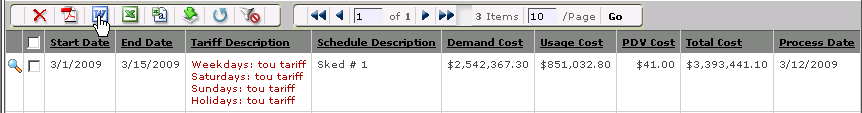
Energy Tracking Analytics also allows the user to create tariffs and generate a bill.
Tariff & Billing:
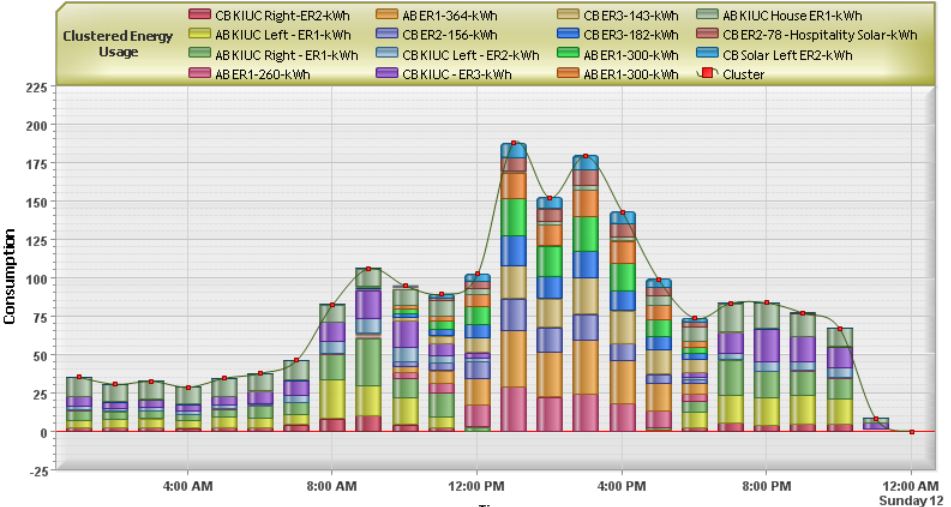
Energy Tracking Analytics also allows the user to Cluster / Group Usage from Multiple Meters.
Clustering:
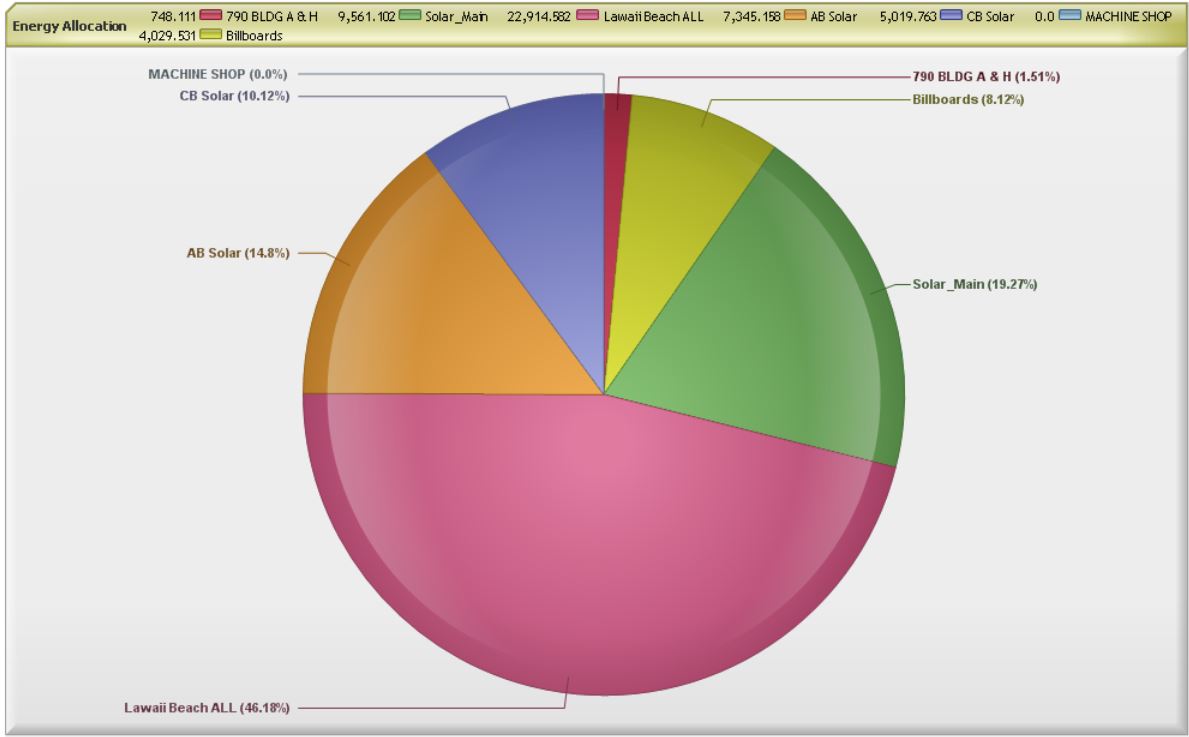
Energy Tracking Analytics also allows the user to Allocate Energy Usage from Multiple Meters.
Energy Allocation:
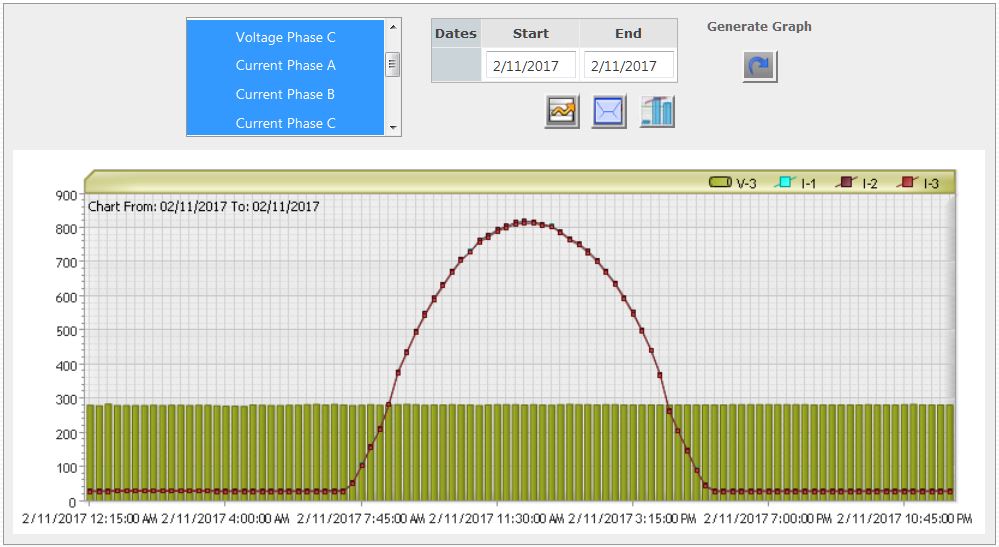
Energy Tracking Analytics also allows the user to track combined Voltage, Current, Power Factor and Demand. Example of Voltage and Current Tracking.
Power Analysis:
| Company | Solutions | WEM-MX Electric Meter | WEPM Pulse Data Logger | WEM-MX Screen Shots & ET Analytics. | Latest News | Reports | Overview | Applications
|
|
|