Software Options:
All our products have a built-in web server that can easily be accessed via MS Internet Explorer web browser.  WEM-MX Screen Shots & ET Analytics. WEM-MX Screen Shots & ET Analytics.
Our Enterprise Energy Tracking Analytics Web portal (ETA) (Click here for more details on ETA) provides significant reporting and management capabilities. ETA is an enterprise level energy information management software cloud based web portal that automatically collects and manages valuable energy data and then translates the data into useful and actionable insights to the customers.
ETA’s cloud-based robust data capture and analysis help users gain control over their energy costs via variety of interactive and automated energy analytics tools that are delivered via a convenient and easy to use web browser.
ETA manages large volumes of historical data from meters. It presents current data up to the last granular interval, hourly, daily, and monthly or yearly as well as historical data both in tabular and graphical form providing greater visibility and control of energy consumption.
We also offer a Real-Time Mobile Application for Android OS. Click here for more details on ET RTM
For low volume applications where data does not need to be shared, Energy@DeskTop is the best option.
Energy@DeskTop Software:
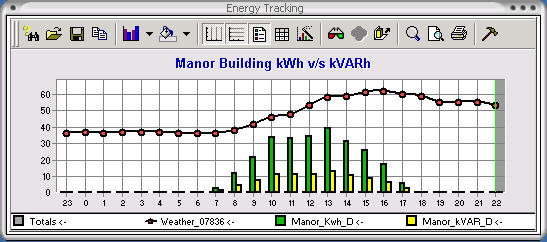
Energy@Desktop is a very advanced and powerful application that acquires real time energy data from our meters and loggers. It displays and also stores energy usage data in a local database for future analysis.
Energy@Desktop is an ideal application for energy mangement and is uniquely customizable: charts, grids, names, colors can all be changed to suit a users needs. Energy@Desktop is a breakthrough application that helps users track their energy usage.
- Acquires data from meters and loggers 24x7 via email, ftp or http
- Displays current as well as monthly demand and consumption data
- Displays load profile data in a grid as well as graph
- Ability to chart and print load profile data over intervals, hours or days
- Aggregates interval data from multiple sources
- Displays consumption and peak demand data by time of use (TOU)
- Displays timestamp of peak demand by time of use
- Saves load profile data into a local database
- Allows user to generate, print and save a bill
- Sends email when kW threshold is exceeded
- Charts consumption for multiple meters
- Access current and last months kW and kWh data
- Compare consumption based on historical usage
- Forecasts consumption based on historical usage
- Allows math computation on any data series.
| Company | Solutions | WEM-MX Electric Meter | WEPM Pulse Data Logger | ET Analytics | WEM-MX Screen Shots & ET Analytics. | Latest News | Reports | Overview | Applications |
|